Features Product How it works Security Pricing Get Tracelet
v1.0 Now with fleet telemetry & AI incident correlation

Know what’s down, what’s slow, and why

Tracelet is a self-hosted appliance and a featherweight Windows agent. Application, network and certificate checks plus deep host telemetry — grouped into incidents, alerted on your terms, and rolled up into one executive dashboard.

Agentless checks free forever Installs in minutes One-click MSI fleet rollout
https://tracelet.internal:8000 — Live demo
Tracelet executive dashboard

Built for teams whose infrastructure has to stay up

Government Healthcare Defense Finance Critical Infra
24/7
Scheduled checks & alerting
8
Telemetry collectors per host
15 min
Appliance to first metric
6
Monitoring surfaces, one pane
One pane of glass

Everything you monitor, finally in one place

Endpoints, networks, certificates and full host telemetry — correlated, alerted, and explained.

Application & API checks

HTTP, TCP and platform health probes with response-time history, status codes and uptime SLAs at a glance.

Network monitoring

Latency, packet loss and reachability across every target. Ping and TCP fallbacks see through Windows firewalls.

Certificate watch

Track expiry, issuers and validity windows for every TLS endpoint. Get warned weeks before anything lapses — never get caught.

Machine & fleet telemetry

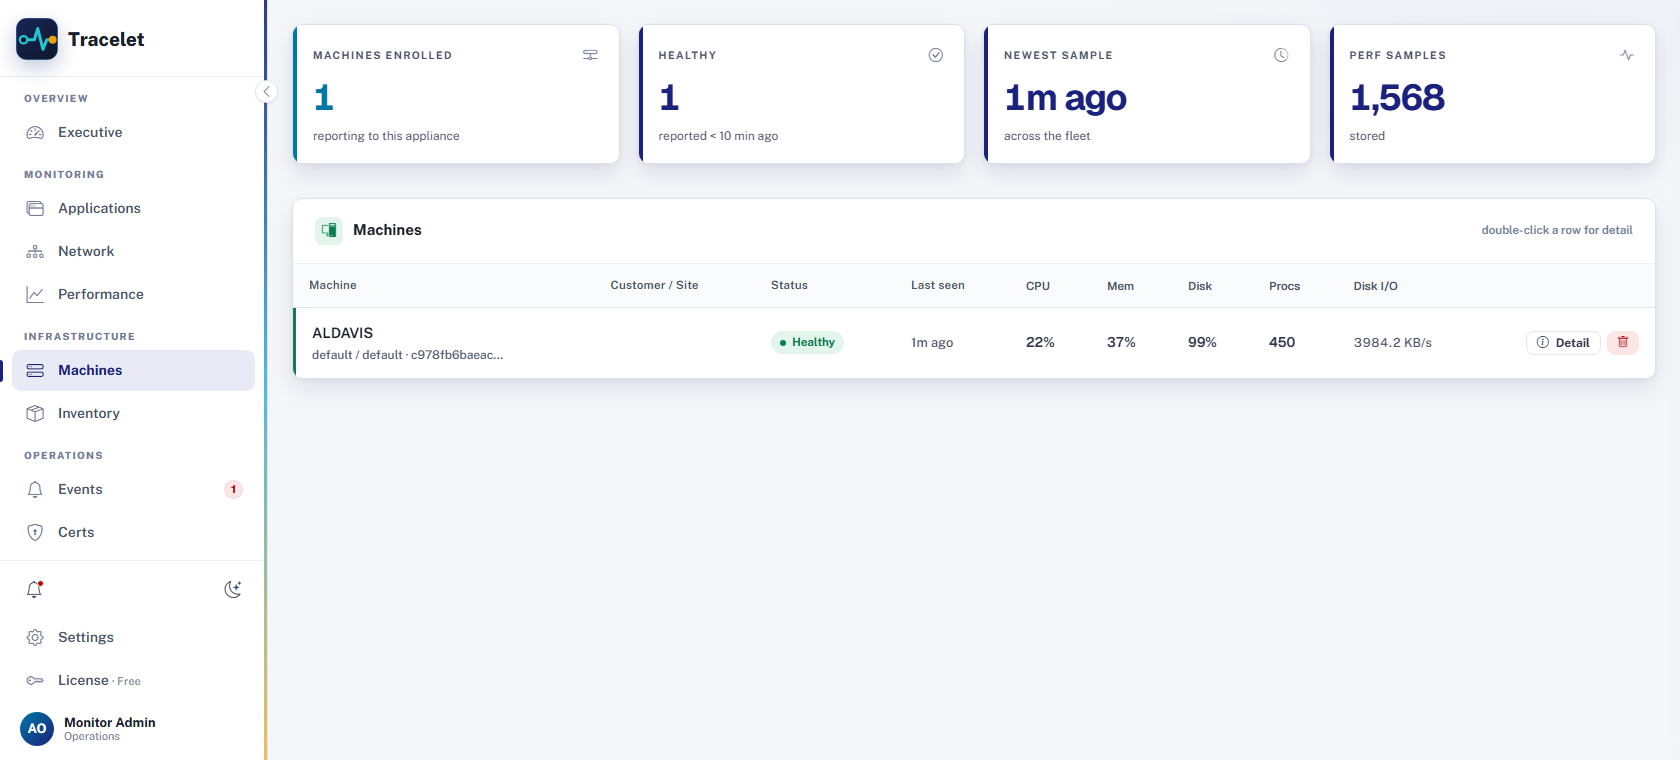
A single lightweight Rust agent streams CPU, memory, disk, I/O, network, top processes and event logs — securely, with minimal overhead.

Incidents & alerting

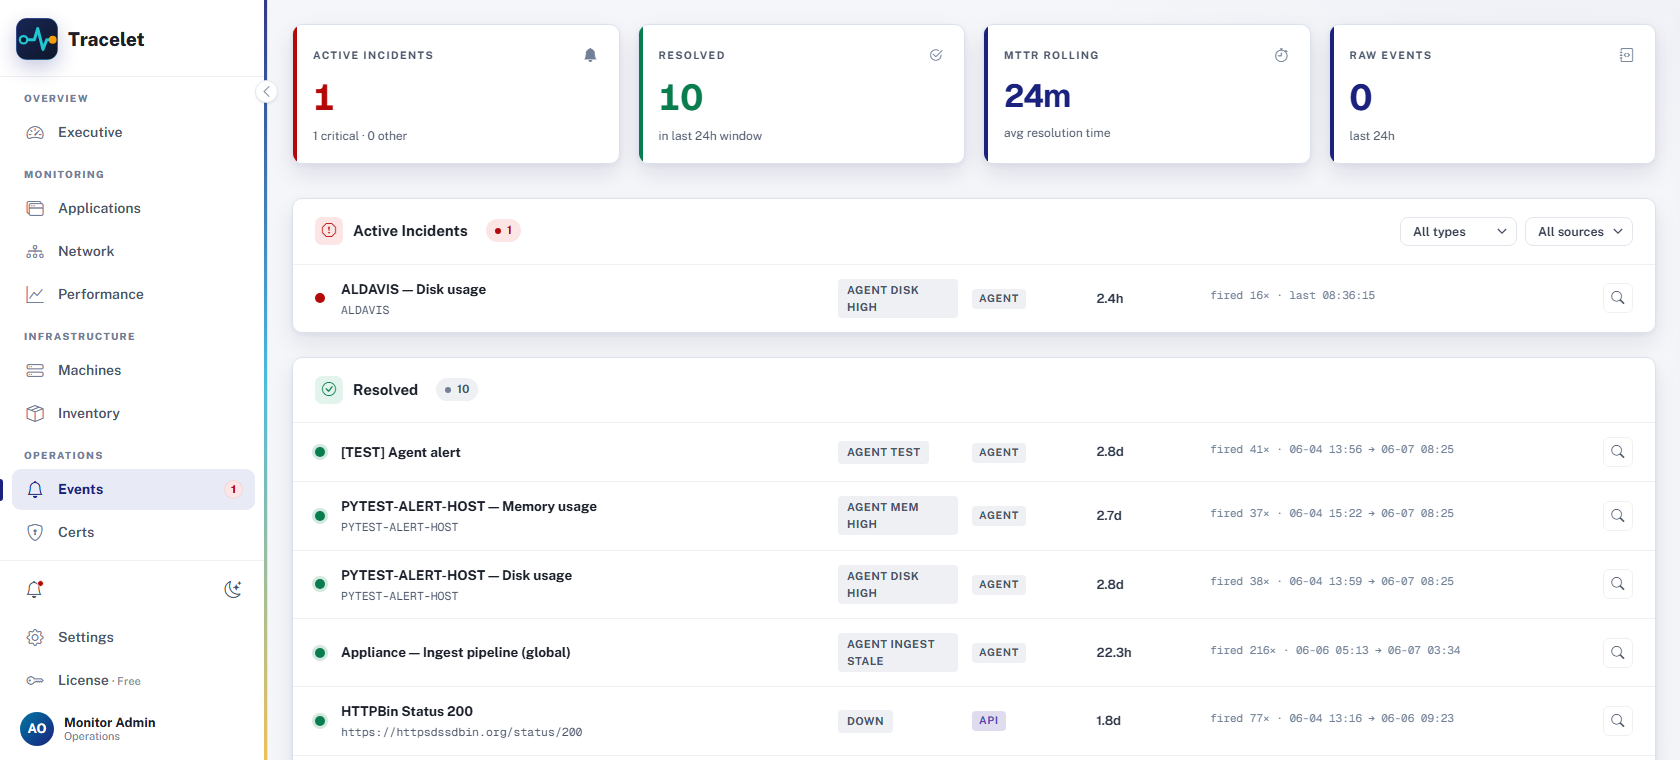
Repeat failures collapse into a single incident with accurate active-duration math. Email alerts to your own SMTP — no third party.

AI incident correlation

When something breaks, AI triage correlates the failure across endpoints, hosts and certificates and writes up the likely root cause — an answer, not a wall of logs.

Executive view

The whole estate in five seconds

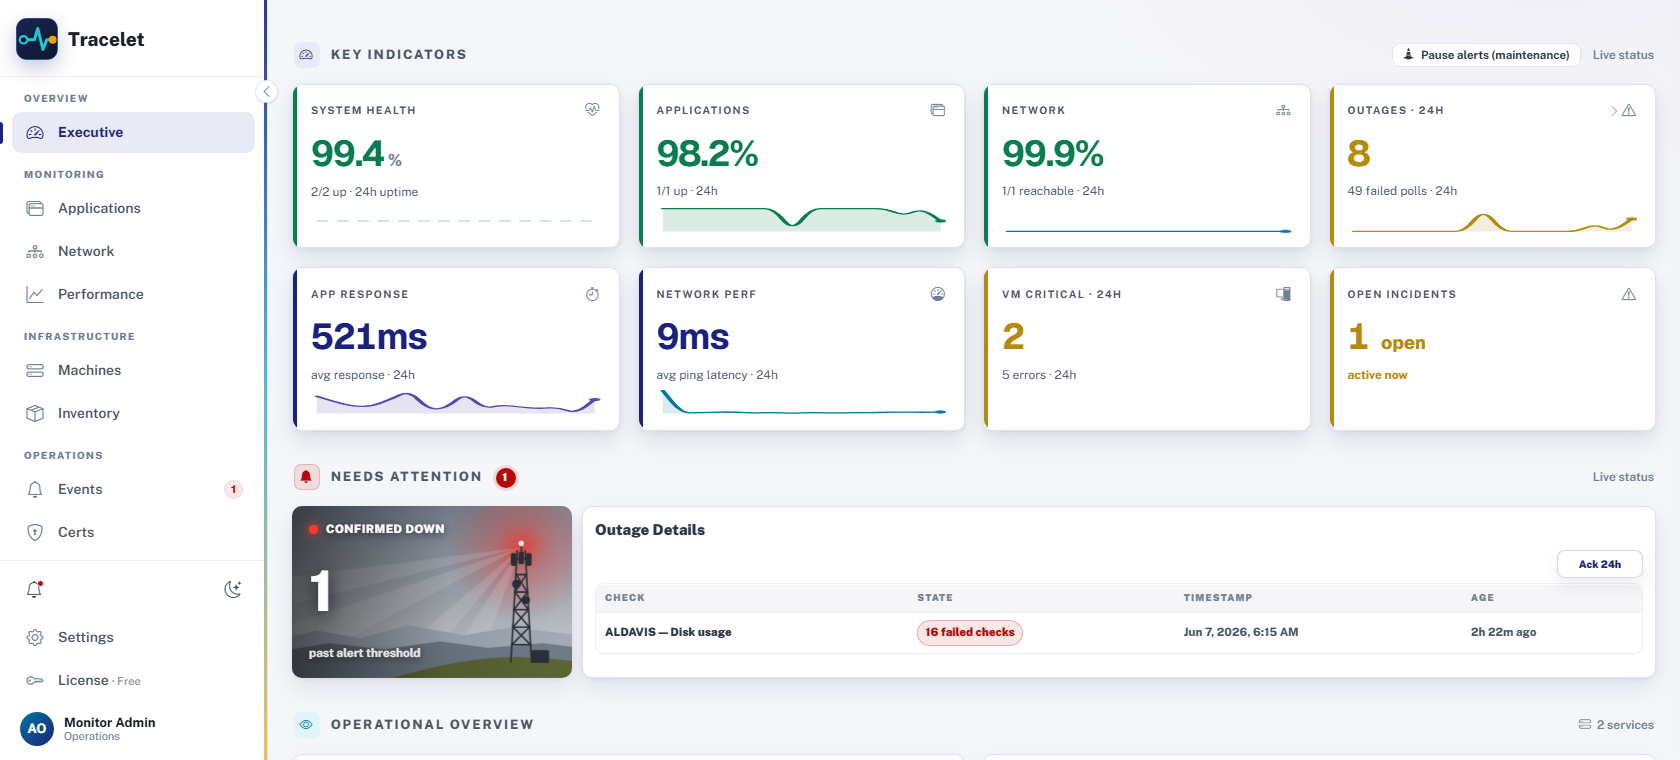
Walk in, glance once, know everything. The executive dashboard rolls up uptime, active incidents, recoveries and delivery health into an attention queue that surfaces what actually needs you.

  • Attention queue: active incidents, disabled monitors, recoveries, alert delivery
  • Response-time and uptime sparklines for every monitored check
  • Light & dark themes, exec-ready at any hour
/dashboard/executive
Tracelet executive dashboard: key indicators with live sparklines and the attention queue
Fleet & agents

Every Windows machine, deployed in one click

Mint an enrollment code, hand out the MSI installer, done. The agent dedups on hardware ID so reinstalls update in place, beacons on uninstall, and a reachability probe tells offline from broken from gone.

  • One-time or reusable 24h rollout codes for fleet deployment
  • Live "waiting → host connected" confirmation as machines come online
  • Drill into any host: CPU, memory, disk, top processes, event logs
/dashboard/machines
Machines dashboard: enrolled agents with live CPU, memory, disk and process counts
Events & AI

Know what broke — and why — in plain English

Repeat failures collapse into one incident, then AI triage correlates it across hosts, endpoints and certificates and writes up the likely root cause in plain English — an explanation, not a wall of logs.

  • Incident grouping with accurate active-duration math
  • AI root-cause correlation across hosts, network and endpoints
  • Email alerts to your own SMTP — no third-party relay
/events
Events dashboard: active and resolved incidents grouped by host with MTTR
Up and running

From download to dashboard in three steps

Install, enroll, watch. Just your appliance and your machines.

Install the appliance

Drop the Tracelet appliance on any Windows host. It binds to loopback by default and stores everything in your own PostgreSQL.

Roll out the agent

Mint a code from Machines → Add Machine, then push tracelet-agent.msi — or paste the code into the wizard. Hosts appear live.

Watch & get alerted

Metrics flow in immediately. Configure thresholds, point alerts at your own SMTP, and let AI triage explain anything that breaks.

Security by default

Your telemetry is yours. Full stop.

Tracelet was built for environments where shipping monitoring data to a SaaS vendor isn't an option. Nothing leaves your network unless you explicitly send it.

Loopback by default

The dashboard binds to 127.0.0.1. LAN exposure is an explicit, deliberate opt-in — never the default.

CA-pinned agent TLS

Agents pin the appliance CA by file and authenticate with a per-host bearer token. No trust-store tampering.

Zero data egress

Metrics live in your PostgreSQL. Alerts go to your SMTP. No vendor cloud, no telemetry phone-home.

Tenant-scoped enrollment

Codes bind to tenant and client at mint time; only SHA-256 hashes are stored, and cross-tenant use is rejected.

Simple, honest pricing

Start free. Pay only when you scale.

No per-host metering games. One license unlocks the whole appliance.

Hosted checkout is being connected. Reserve a paid tier now and we will issue the signed license when the backend goes live.
Community
$0 / forever

Agentless monitoring for a small estate, on the house.

  • Agentless — no install on monitored hosts
  • Application, network & cert checks
  • Incidents & email alerting
  • Machine agent & fleet telemetry
  • AI incident correlation
Download free
Standard
$49 / month

Unlock agent telemetry and production monitoring for one appliance.

  • Agent telemetry starts here
  • Application, network & cert checks
  • Incidents & email alerting
  • Signed machine-bound license
  • AI incident correlation
Pro AI
$149 / month

Everything in Pro plus AI triage that explains your incidents.

  • Everything in Pro
  • AI incident correlation & root-cause
  • Plain-English incident write-ups
  • Runs on your own OpenRouter API key
  • Dedicated onboarding
Questions

Things people ask first

Does any data leave my network?
No. The appliance binds to loopback by default, stores metrics in your own PostgreSQL, and sends alerts through your own SMTP server. There is no vendor cloud and no telemetry phone-home. It runs fully air-gapped.
What does the agent run on?
A single lightweight Rust binary for Windows, deployed via an MSI installer (interactive wizard or silent msiexec). It collects CPU, memory, disk, I/O, network, top processes, event logs and host inventory, and is built to stay out of your workloads' way.
How are agents secured?
Agents pin the appliance CA by file and authenticate with a per-host bearer token (only SHA-256 hashes are stored server-side). Enrollment codes are bound to a tenant and client at mint time, and cross-tenant use is rejected.
Can I deploy to machines on other networks?
Yes. Run configure-remote with a routable host name; Tracelet re-mints the server certificate with the right SANs and opens the firewall for the agent channel. Already-enrolled agents keep validating — the cert change is additive.
What happens when I outgrow the free tier?
Community gives you agentless application, network and certificate checks free forever. Apply a Standard, Pro or Pro AI license key in Settings → License to unlock agent telemetry, larger fleets and the AI assistant — no reinstall, no data migration.

Put your whole estate on one dashboard

Download the appliance, point it at your estate, and watch the metrics roll in — agentless checks free forever.