Install one Windows appliance to watch internal apps, file shares, DNS, TCP services, ping targets, TLS certificates, network devices, and Windows hosts. See what broke, who is affected, and what changed.
Built for teams that need useful monitoring without buying an enterprise observability suite
Wardix is for teams that need practical monitoring for internal infrastructure, not another telemetry migration, pricing puzzle, or months-long platform rollout.
Run the dashboard where your infrastructure lives and keep core monitoring history under your control.
Start free, then upgrade by appliance edition. No per-metric surprise and no enterprise suite just to watch core services.
Focus on what broke, who is affected, and what to check next instead of building and tuning a monitoring stack.
Wardix starts with practical availability checks, then grows into Windows telemetry, network visibility, reports, and assisted triage when the environment needs it.
HTTP/S, DNS, TCP, and response-time history for the services people notice when they break.
Ping, latency, TCP/DNS probes, and Standard+ SNMP v1/v2c for switches, routers, and devices.
See certificate expiry before it becomes the reason payroll, email, or a customer portal goes dark.
Optional Windows agents add host evidence when a simple uptime check is not enough to explain the failure.
Repeated failures collapse into incidents with acknowledge, resolve, maintenance, cooldown, and suppression workflows.
Pro turns selected incident evidence into a short operator brief with impact, likely cause, and next action.
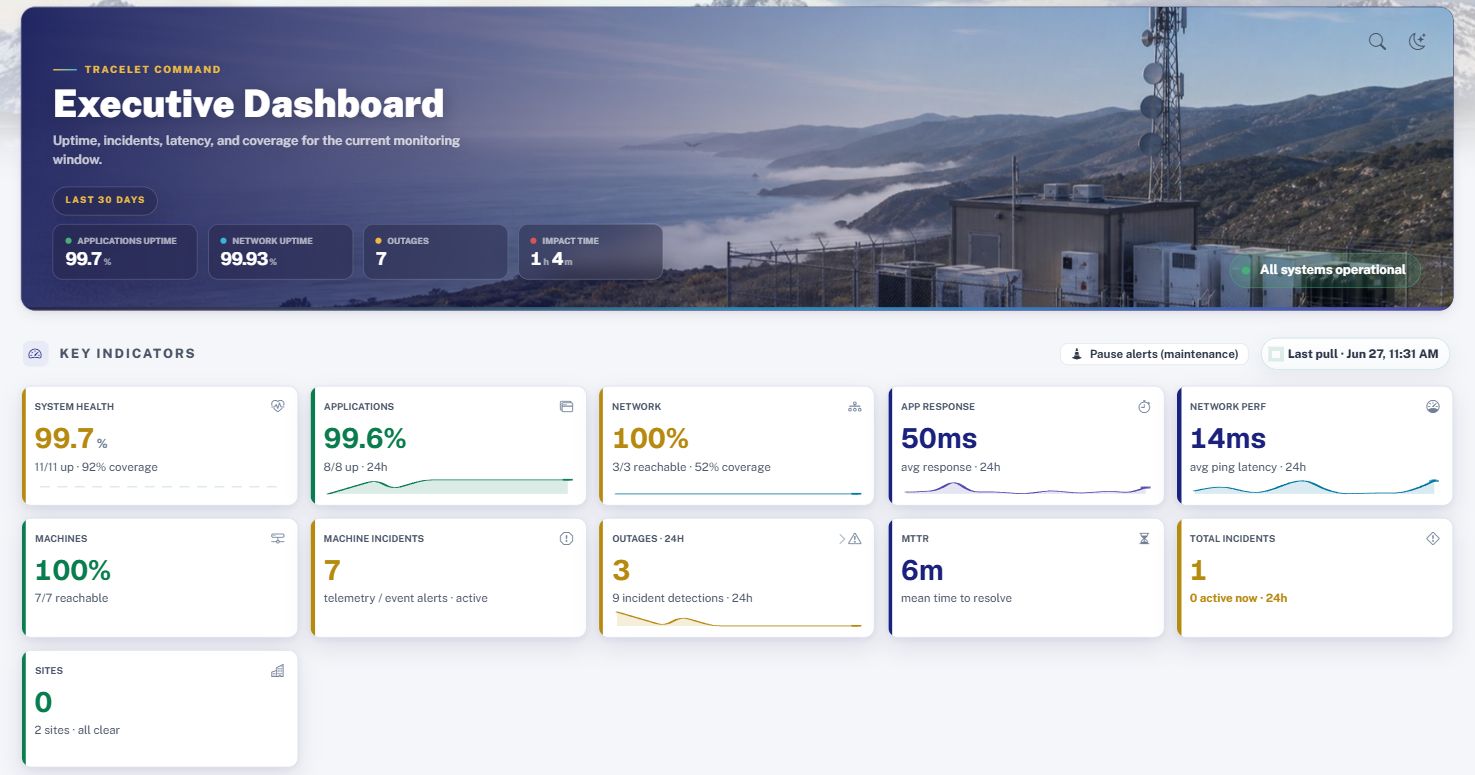
The executive dashboard rolls up uptime, active incidents, recoveries, fleet health, and alert delivery into one operator view.
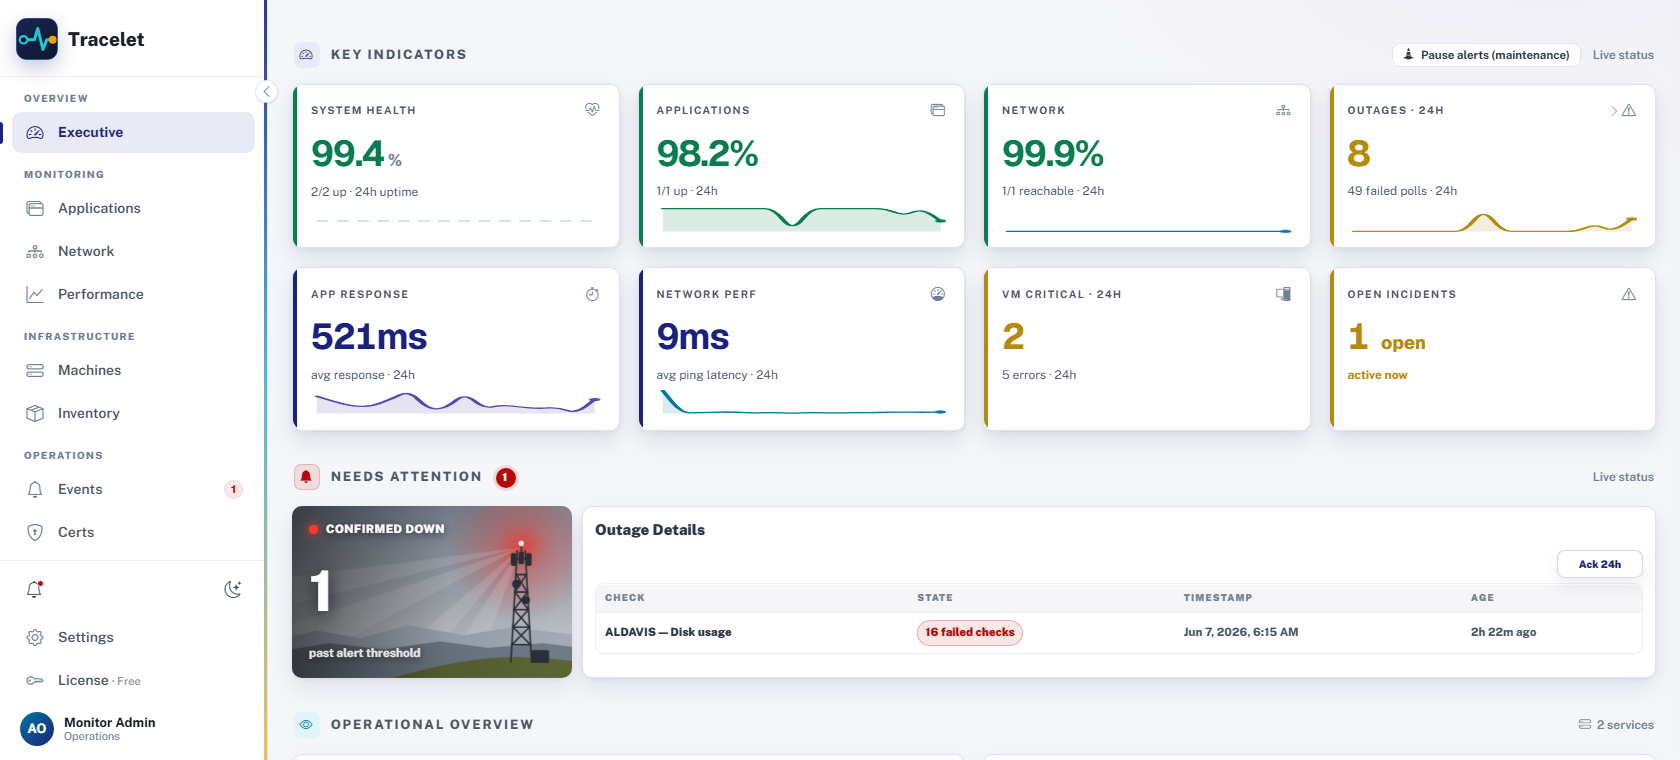
Wardix monitors the services and network paths people depend on: HTTP/S, DNS, TCP, SMB, ICMP, SNMP devices, and TLS certificates.
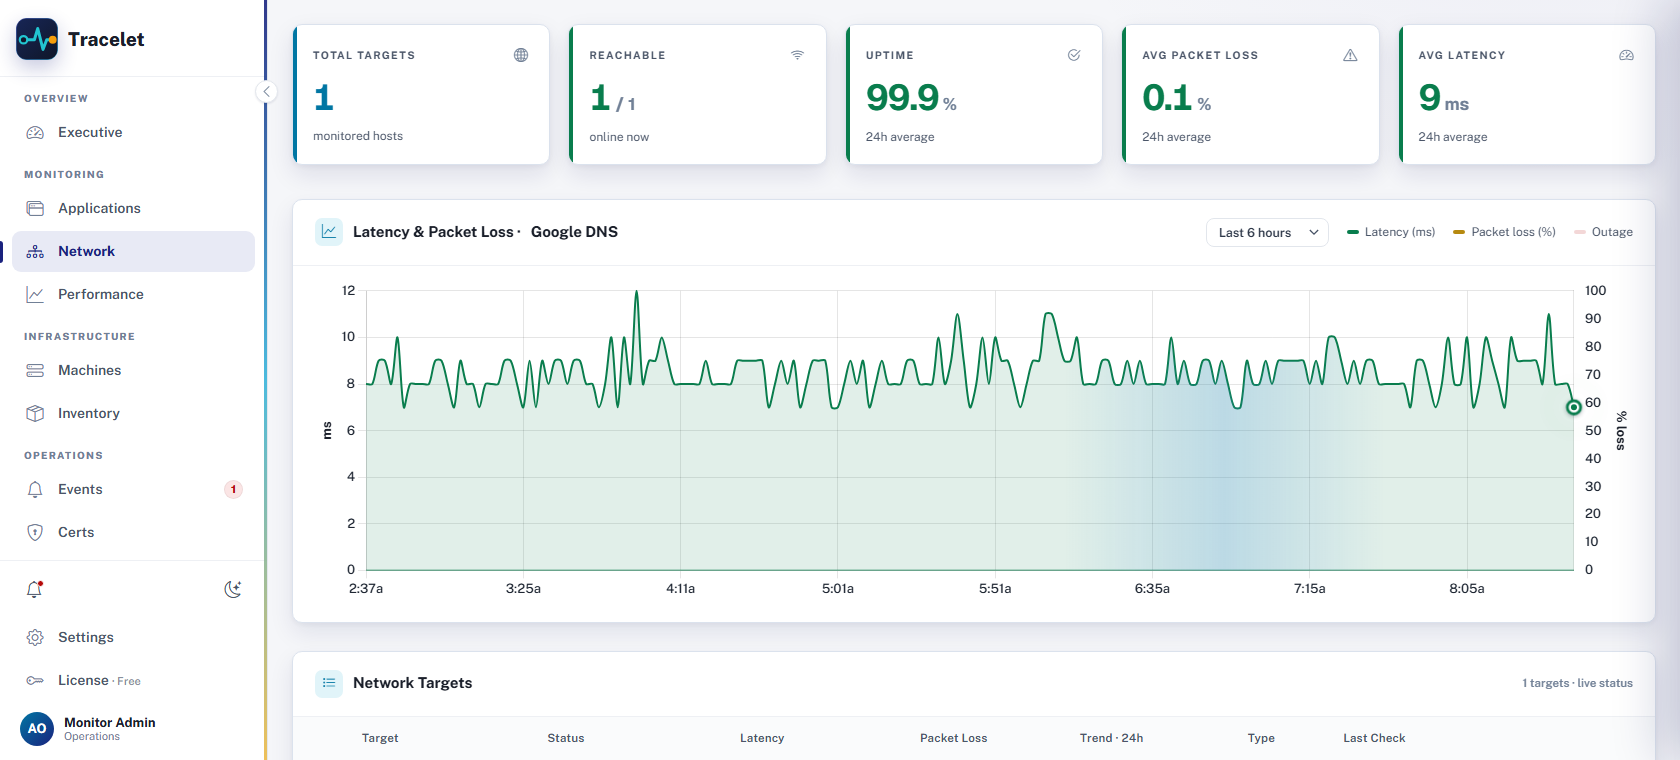
Standard unlocks remote Windows agent telemetry. Enroll hosts with a code, deploy the agent MSI, and see machine health beside your service checks.
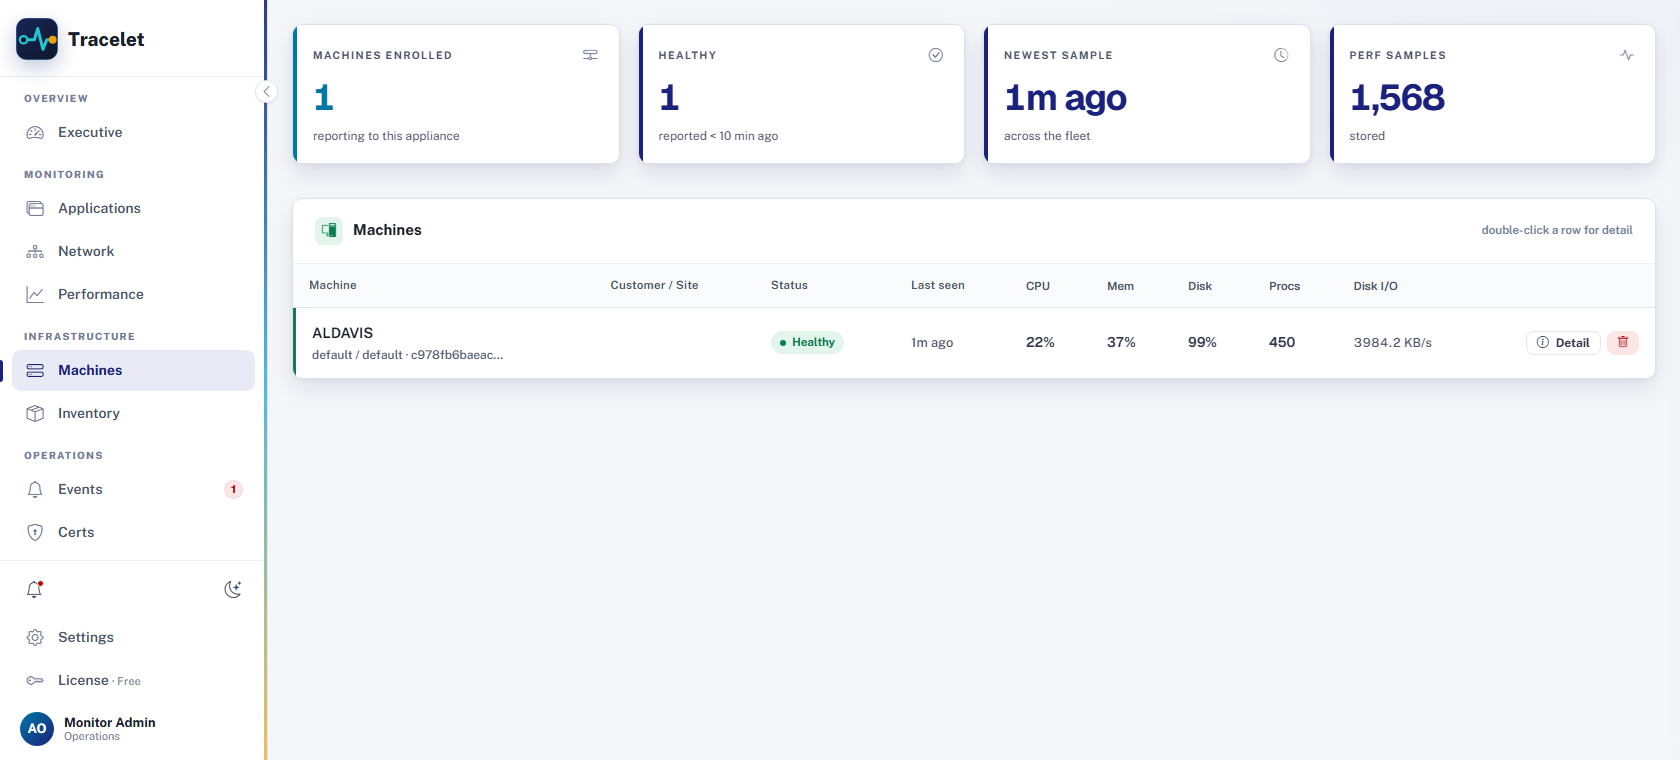
Wardix groups repeated failures into incidents. Pro adds a triage brief that summarizes selected incident evidence through your configured AI provider when you enable it.
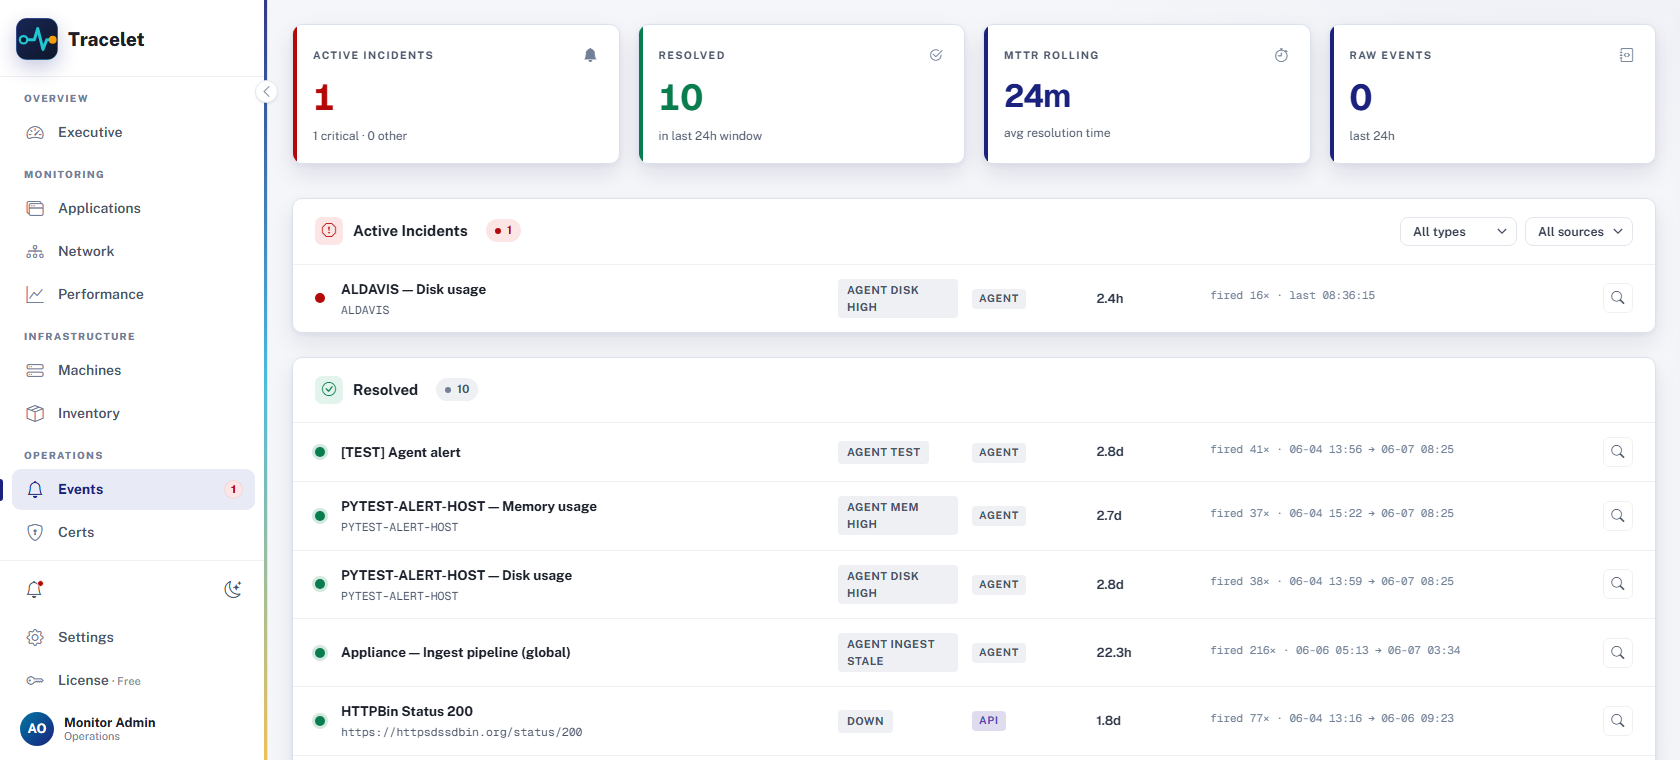
Wardix is built for teams that want useful production monitoring without a long platform rollout.
Run Wardix on a Windows host and open the local dashboard. No separate observability stack is required to begin monitoring.
Start with websites, file shares, DNS, ports, ping, and certificates. Add network devices and Windows agents when you move to Standard.
Route alerts to the channels your team already watches, schedule SLA reports, and use Pro triage when you want a faster first read.
Wardix runs the monitoring workload locally. Dashboards and routine history stay on the appliance; account access, updates, alert delivery, support, and Pro AI triage are intentional outbound integrations you enable.
Your team uses the appliance as the source of truth for monitored services, incidents, dashboards, and reports.
Windows agents enroll only when you authorize them, so fleet telemetry stays tied to systems you manage.
Updates, account access, support, alert delivery, and Pro triage are visible choices. If Pro triage is enabled, selected incident evidence is sent to your configured AI provider.
Use Wardix for branch offices, clinics, labs, MSP customers, factories, or any team that needs practical local visibility.
Community is useful on day one. Standard is the production tier for Windows and network monitoring. Pro adds assisted triage for teams that want it.
For trying Wardix or monitoring a small internal estate.
For production Windows and network monitoring.
For teams that want assisted incident triage.
Download Community, monitor the basics, and upgrade only when you need Windows telemetry, SNMP, access control, reports, or assisted triage.